
Resources for Chapter 4:
Estimating with uncertainty
Web visualizations
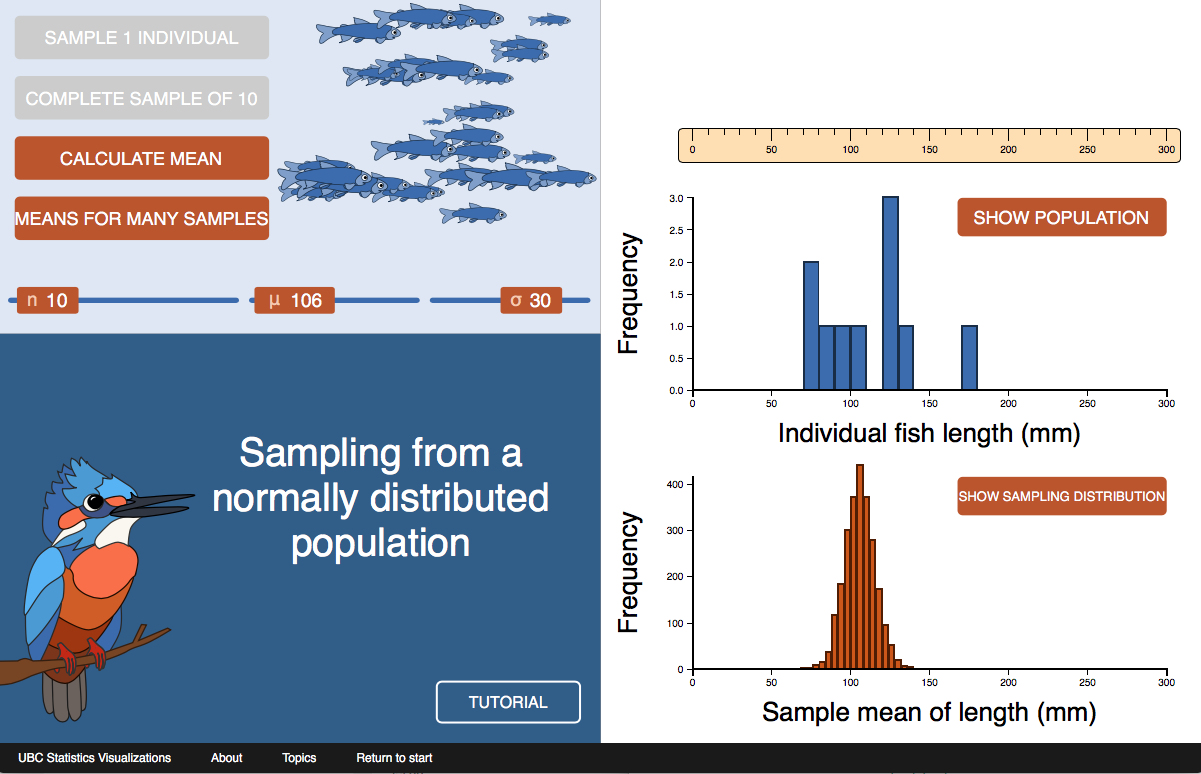
A web visualization that demonstrates the properties of the mean calculated from a saample here.
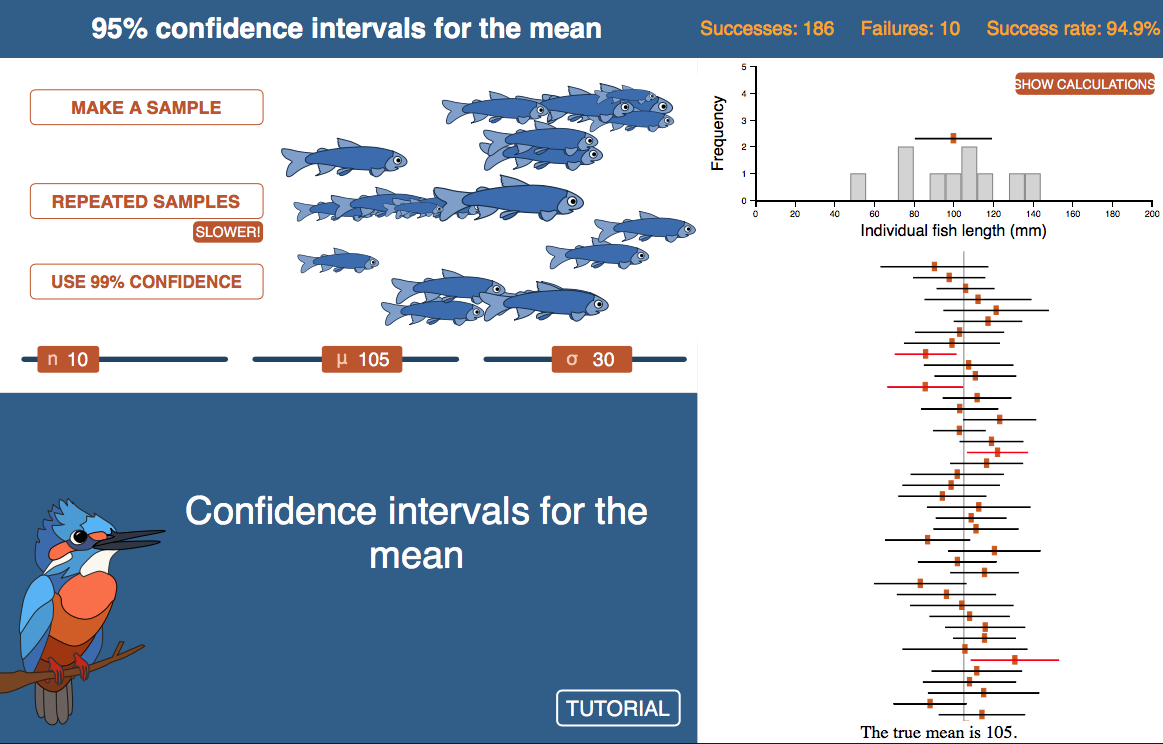
A web visualization that demonstrates the idea of the confidence interval here.
R lab
A lab on how to compute confidence intervals for means in R, and related topics, is available here.
Learn R by example
We used R to analyze all examples in chapter 4. We’ve put the code here so that you can too.
Data
Download a .zip file with all the data for chapter 4 in .csv format here.
Download a .zip file with all data sets in the book here.
All data sets and their sources are listed individually below.
Disclaimer: Most data sets used in the book are grabbed from graphs and tables in the original publications, and the values may not be exact. Contact the original authors for the raw data.
Data for examples
Example 4.1. Human gene lengths
Zerbino, D. R. et al. 2018. Nucleic Acids Research 46: D754–D761.
Data for problem sets
Cratsley, C. K., and S. M. Lewis. 2003. Behavioral Ecology 14: 135–140.
Guelzim, N., S. Bottani, P. Bourgine, and F. Képès. 2002. Nature Genetics 31: 60–63.
Beath, D. D. 1996. Journal of Ecological Ecology 12:409-418.