
Resources for Chapter 10:
The normal distribution
Web visualizations
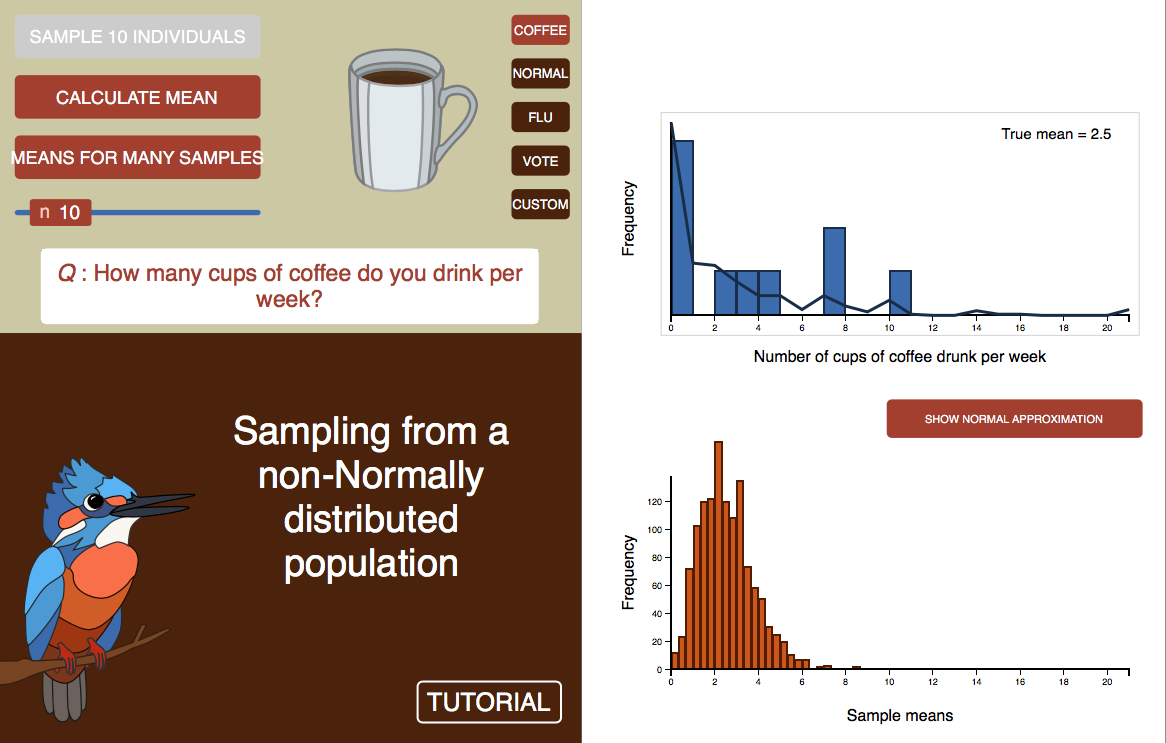
A web visualization about the Central Limit Theorem and sampling from non-Normal distributions is here.
R lab
A lab on investigating the normal distrirbution using R, and related topics, is available here.
Learn R by example
We used R to analyze all examples in chapter 10. We’ve put the code here so that you can too.
Data
Download a .zip file with all the data for chapter 10 in .csv format here.
Download a .zip file with all data sets in the book here.
All data sets and their sources are listed individually below.
Disclaimer: Most data sets used in the book are grabbed from graphs and tables in the original publications, and the values may not be exact. Contact the original authors for the raw data.
Data for examples
Example 10.6. Deaths from Spanish flu 1918
Human Mortality Database. University of California, Berkeley (USA), and Max Planck Institute for Demographic Research (Germany). Available at www.mortality.org or www.humanmortality.de. Accessed January 18, 2012.
Data for problem sets
Clark, D. B., and D. A. Clark. 2012. Ecology 93: 213.
Heiling, A. M., M. E. Herberstein, and L. Chittka. 2003. Crab spiders manipulate flower signals. Nature 421: 334.